Whose websites emit the most carbon-dioxide? We examined the websites of the most important players of six industries (telecommunications, supermarkets, financial institutions, energy, news sites, e-commerce) from the perspective of their carbon emissions. What we were curious about are the similarities and differences among them —and, of course, we wanted to find out which site is the cleanest and the dirtiest. Would you like to know how each area performed? Scroll down and find out!
Let’s start with some interesting facts that we will later explain in more detail:
- The page that emits the most carbon (a main page) belongs to the same industry as the cleanest page (a subpage)
- The second dirtiest main page can be found within the overall cleanest industry
- The cleanest main page is 33 times cleaner than the dirtiest one
All digital activities have a carbon footprint, including our own website. In order to find out how much carbon our website emits and why, we have to examine it from several aspects. By multiplying the net carbon footprint —generated by a single page download —by the traffic, we get the gross carbon footprint, which can provide a more accurate picture of our website. As an external player, we do not have access to traffic data, so we focused on the net carbon footprint. During our examination, we analyzed 52 companies—with three subpages per company. We took into account the overall average of the sites we measured in terms of the home pages (1.71 grams) and the other examined subpages (1.2 grams). We also looked at how the sectors perform compared to the global average accepted by the industry (0.5 grams).
Telecommunications
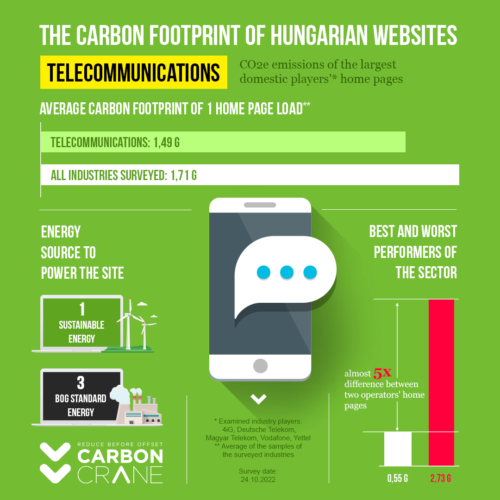
In terms of main pages, telecoms was the second cleanest sector, and there were several companies in this industry that performed below the global average of 0.5 grams. The websites of the companies we examined (4iG, Deutsche Telekom, Magyar Telekom, Vodafone, Yettel) produce an average of 0.91 grams of CO2e, which is the best value among the six industries. This is partly due to the fact that there was only one site that exceeded the average of all the companies we examined, by 1.75 grams. There are also two companies in this sector that are among the top ten, one of them being the cleanest if we consider all subpages. The home page average of 1.49 grams is 15% less than the average of 1.71 grams for all industries surveyed. However, this is not true when examining all sites, as there are two companies whose average carbon emissions of all their subpages are less than 0.5 grams. This fact also shows that home pages play an important role everywhere, but solely looking at them might not provide a complete picture in terms of sustainability. It is interesting that, while there is only one telecommunications website whose server runs on renewable energy sources, the industry’s websites are overall cleaner than supermarket websites, of which 63% is powered by sustainable energy sources. This also proves that changing any factor alone is not enough if we want to achieve real results in terms of carbon efficiency.
Banks and financial institutions
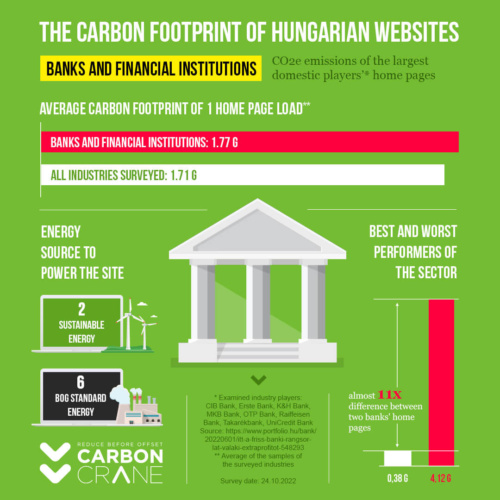
The sector of banks and financial institutions includes the 4th, 6th and 8th dirtiest companies, observing all subpages. However, one of the banks is also the third cleanest in terms of home pages and websites, yet it cannot boost the sector to such an extent that it can be shown in the overall averages. Considering the examined players (CIB Bank, Erste Bank, K&H, Bank, MKB Bank, OTP Bank, Raiffeisen Bank, Takarékbank, UniCredit Bank) the average of the websites exceeds the overall average of 1.2. One the other hand, the average CO2e emissions of the main pages is only 0.6 grams more than the average of all main pages, and2/3 of the main pages emit less than 1.71 grams of carbon. The 4.12-gram value of the industry’s dirtiest home page is eleven times worse than that of the lowest carbon-emitting main page, which is 0.38 grams. The overall picture is supported by the fact that only a quarter of the examined home pages of banks and financial institutions (two in total) use sustainable energy sources to operate their websites.
Supermarkets
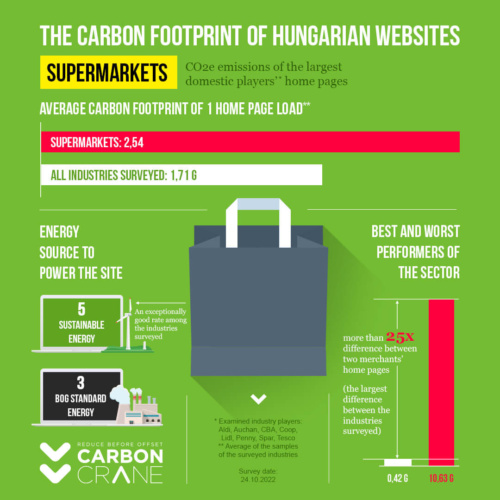
Outstanding results, huge differences, and surprising curiosities—these are what we have discovered during the analysis of supermarket websites. There is a whopping 25x difference between the dirtiest and cleanest home pages, and the worst-performing home page emits 10.63 grams of carbon dioxide. Even the 19 cleanest home pages all together do not produce that much CO2e in total. The two biggest flaws of this home page are that it contains a lot of poorly optimized images and that it runs on WordPress, which is not a great solution in terms of sustainability and carbon reduction. It is interesting however that even in this sector we can’t only find dirty pages: among the supermarkets there are also three companies whose main pages are among the 10 cleanest ones. There were also two companies with home pages below the global average carbon footprint (0.5 grams) and three more were, on average, below that with all their pages we examined. In addition, this industry also has the cleanest subpage, with only 0.18 grams of carbon dioxide emissions. Considering the averages of the 52 players we looked at, 67% of the companies have values below the average for all pages as well as for main pages.
E-commerce
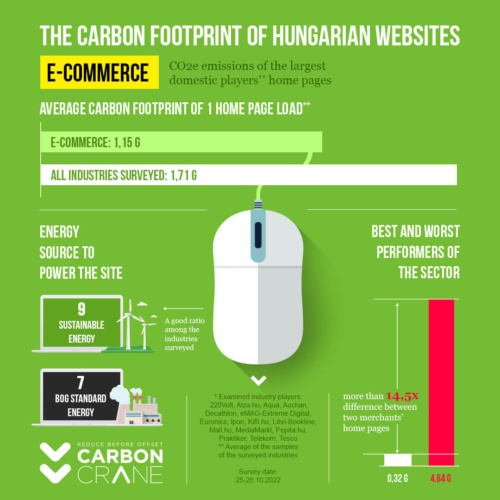
Among the six industries, e-commerce achieved the best result – with an average carbon emission of 1.15 grams it was classified as the cleanest sector in terms of home pages. The examined websites (220Volt, Alza.hu, Aqua, Auchan, Decahtlon, eMAG-Extreme Digital, Euronics, Ipon, Kifli.hu, Libri-Bookline, Mall.hu, MediaMarkt, Pepita.hu, Praktiker, Telekom, Pepco) are not only interesting from a communication perspective, but because they also serve as a direct sales channel, playing an even greater role in the lives of users. Of all the home pages monitored, the cleanest one can be found here, emitting only 0.32 grams per page load—33 times less than the most carbon-producing site. Although 81% of home pages emit less carbon than the global average, yet e-commerce also has the second dirtiest main page with 4.64 grams. If we examine not only home pages, four companies of this sector can be classified among the cleanest ones, even though one of the companies is the 5th dirtiest. Overall, e-commerce can be stated to be clean despite the fact that, like news portals, it works with a lot of images. This let us conclude that in the case of the sites competing here, these companies are consciously working on improving the user experience, which improves not only carbon efficiency but also loading speed.
News sites
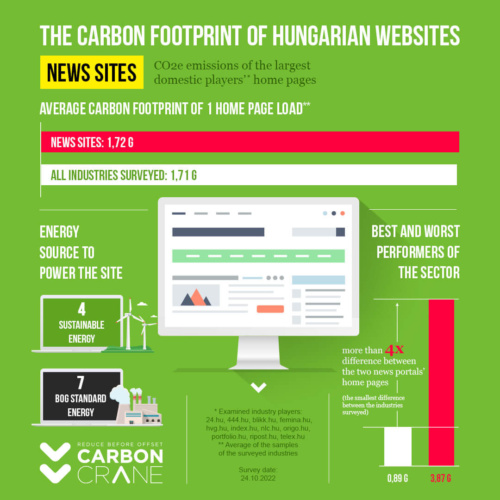
The mid-range carbon performance and a dominant role of images characterize the sector’s surveyed sites: 24.hu, 444.hu, blikk.hu, femina.hu, hvg.hu, index.hu, nlc.hu, origo.hu, porfolio.hu, ripost.hu, telex.hu. The average of their main pages exceeds the overall average value of 1.71 by only 0,01 gram. The difference between the worst and best performing main pages in this industry is the smallest we found, adding up to a difference of 4x. Overall, with 1.18 grams, it just doesn’t exceed the average of the 52 analyzed websites, even though not even a single news site made it into the top ten cleanest pages. As in case of e-commerce, images play an important role in this industry as well, so it is probably also the reason why their websites face an uphill battle in terms of CO2e emissions.
Energy
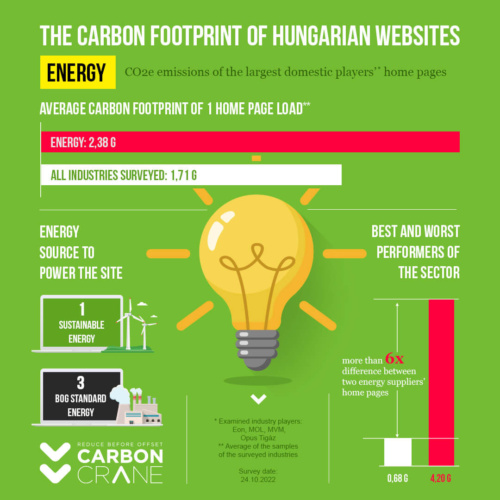
If only the opening pages are considered, the energy industry is the second dirtiest industry of our survey. However, when looking at the other sub-pages as well, it performed even worse than supermarkets. We examined four companies in this industry: Eon, MVM, Mol, Opus Gáz. The average carbon emission of their home pages is almost one and a half times more than the overall average of 1.71 grams. In addition, there are three home pages in this sector that are dirtier than the average of all home pages. Moreover, not a single one of the examined home pages or websites are below the global average. If we take the participants of our own survey as a basis, only one of the companies performs below the average in all examined respects. In fact, one of the subpages belonging to the industry emits 5.13 grams of CO2e while operating on a sustainable energy source, thanks to which it already cuts around 10% of its carbon footprint. The second dirtiest page can also be found here, in terms of carbon emission, and there are two more players who can be ranked among the worst ten.
Conclusion
Following the examination of the six industries, we can draw the overall conclusion that there is still plenty of room for many companies to optimize the carbon footprint of their websites. It is important to note that in the present study, we did not calculate the traffic volume and its distribution, which is the main determinant of the total size of the footprint. The number of visitors, their location and the rate of returners are all factors we have to take into account when dealing with the gross carbon emissions of our website. Since marketing is understandably not meant to reduce traffic, the best solution is to minimize net carbon emissions of the busiest pages, so that traffic increases a smaller footprint.
At Carbon.Crane, our mission is to make carbon emissions play an important role when planning and evaluating marketing campaigns, in addition to efficiency. This is why we created our Website Carbon Monitor solution, thanks to which we can get a complete and detailed picture of the carbon efficiency of our website. By examining the traffic within and arriving to the website, it shows all the possibilities for reducing carbon emissions and models their effectiveness in several versions.
Previously we successfully reduced the CO2e emissions of one of Carbon.Crane’s websites to its seventeenth. Would you like to know how we did it? Here you can read more about it.




Comments are closed.